R Tutorial: Token Distribution and Regular Expressions
Introduction
“This chapter explains how to use the positions of words in a vector to create distribution plots showing where words occur across a narrative. We introduce the grep function and show how to use regular expressions for more nuanced pattern matching.” (Jockers 2020: 37)
This tutorial is based on Jockers’ Text Analysis with R For Students of Literature, Chapter 4: “Token Distribution and Regular Expressions”. The grep() function used in that chapter for search with regular expressions does not work well with Arabic script, so we will use the search and replace functions from the tidyverse’s stringr library instead.
The tidyverse is a collection of R packages for data science that work together well because they share the same philosophy, grammar and data structures. The most important packages for us will be stringr (for working with text strings) and ggplot2 (for creating plots and other graphics).
To install all packages of the tidyverse, simply run:
> install.packages("tidyverse")This will install all packages in the tidyverse collection, including stringr.
Remember, a package needs to be installed only once; but in every session you want to use that package, you need to load it using the library() function.
Setting up
We will start the tutorial with some code we created in the previous classes. Please click the “Run” button below the script to load the example text (al-Tabari’s history) and tokenize it:
We will mostly be using the variable book_word_v, which contains the tokenized text of Ṭabari’s History.
A word about coding style
(Jockers p. 38)
It is good practice to stick to some principles while coding:
- variable names:
- use lower-case characters, and split words by underscores
- Jockers often uses a single character at the end of a variable name to indicate which data type is contained by the variable (
_vfor vector,_lfor list, etc.)
- use spaces before operators like
<-and=
These are not fixed rules in R (R does not care whether you use upper-case characters in variable names, and remove the spaces before and after =), but adhering to a specific coding style makes it easier to read your code for others, and for yourself to remember how you named your variables.
For an example of a well-developed style guide for writing R code, see https://style.tidyverse.org/syntax.html.
Dispersion plots
(Jockers p. 38-)
Chapter 2 showed how to calculate and display raw and relative frequencies of words on the level of an entire book. In this chapter, we will look at how words are distributed within one book. In Jockers’ Moby Dick example: “At what points, for example, does Melville really get into writing about whales?”
Instead of collapsing an entire book into a frequency table, which does not take the sequence of words into account, we will now plot words in a sequence from the first word of the book to the last.
In order to visualize the distribution of the use of a word in the text, we will create a dispersion plot. A dispersion plot looks like a barcode:
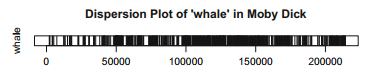
Jockers’ dispersion plot for the word “whale” in Moby Dick
The (horizontal) X axis represents the position of each word in the book (1 is the first word, 20.000 is the 20.000th word). In the example above, for each time the word “whale” is mentioned in Melville’s Moby Dick, a vertical black line is drawn at the position of that word in the text (e.g., if the 200th word of the book is “whale”, a black line will be drawn at position 200 on the X axis.) Note that every line in the plot is the same width; if some lines appear wider than others, that is because they are actually a lot of lines positioned closely together.
In order to create such a plot, we will have to go through a number of steps:
- choose a word of which we want to visualize the distribution in the text
- tokenize the text (already done in the setup script; stored in the
book_word_vvariable) - identify the positions of the word in the book
- plot these positions in a graph.
We first have to identify where our word is located in the text. As in chapter two, we will use the tokenized text (stored in the book_word_v variable) as the basis for our analysis.
To identify the positions in which our word is used, we will use the str_detect() function from the stringr package. This function takes two arguments: a character vector containing one or more strings, and a regular expression pattern that describes the word(s) you want to match. The function checks for every string in the vector whether it matches the regular expression you provided. It returns a vector that contains TRUE for every string that matched the regular expression, and FALSE for every string that did not match.
A preparatory example
In programming, it is often useful to test your code with some dummy data, so we can understand better what is happening when you run the code. Let’s do this for the str_detect() function, and see how it works:
If you push the Run button above, you will see the output of the str_detect function: a vector containing the value TRUE for every string in the test_v vector that contains the character “a” followed by another character, and the value FALSE for every string that does not match the regular expression.
We can now use the plot() function to create a dispersion plot from the output of the str_detect function:
Because we set the plot type to h (for “histogram”), the plot() function will, for every element in the match_v vector, draw a vertical line from the X axis; the length of the vertical line is defined by the element’s value.
This works because for our match_v vector because that vector contains TRUE and FALSE values, which the plot() function automatically converts to their numerical equivalents, 1 and 0:
- for the first element in the
match_vvector (TRUE), theplot()function will draw a line of height 1 on position 1 of the x axis; - for the second element in the
match_vvector (FALSE), theplot()function will draw a line of height 0 on position 2 of the x axis; - for the third element in the
match_vvector (TRUE), theplot()function will draw a line of height 1 on position 3 of the x axis; - for the fourth element in the
match_vvector (TRUE), theplot()function will draw a line of height 1 on position 4 of the x axis
A real-world example
We will use the terms ḥaddathanī/ḥaddathanā, “he transmitted to me/us” as an example. These terms are very important in the context of the isnād, a common citation practice in Arabic texts, in which a report is quoted together with every person (transmitter) who links the source to the original event reported.
This is an example of an isnād:
فحدثني محمد بن عمارة الأسدي ومحمد بن منصور قالا: حدثنا عبيد الله بن موسى، قال: أخبرنا موسى بن عبيده عن اياس ابن سلمة بن الأكوع، عن أبيه، قال: بعثت قريش
Muḥammad b. ʿUmāra al-Asadī and Muḥammad b. Manṣūr transmitted to me (ḥaddathanī): ʿUbayd Allāh b. Mūsā transmitted to me (ḥaddathanī): Mūsā b. ʿUbayda transmitted to me (akhbaranī), on the authority of Iyās ibn Salama b. al-Akwaʿ, on the authority of his father: “Qurays sent etc.”
The verb ḥaddatha is related to the term ḥadīth, which is used for transmitted reports on the words and deeds of the Prophet Muḥammad. The implications of the term ḥaddathanī/ḥaddathanā are not well understood; in ḥadīth studies, it is generally accepted that the term indicates direct oral/aural transmission of a report from a teacher to a student (as opposed to citation from a written book outside of a teaching context). There is less of a consensus on the use of the term in other genres than ḥadīth works.
We will try to use dispersion plots to get an insight into the distribution of this term, and another often used transmission term, akhbaranī/akhbaranā, “he transmitted to us”, in al-Ṭabarī’s History. That work is a universal history from the creation to the year 302 AH / 915 CE; the period after the hijra is organized in an annalistic way (the events of each year are narrated in a separate chapter).
First, we will create a vector that records which tokens in the text match a regular expression pattern that describes all possible variations of the term: حدثن[ياى] (that is, the string “ḥaddathan” followed by either alif (ā), yā' (ī), or alif maqṣūra (which is often used to represent a yā' in final position in printed books)).
NB: RStudio, like many other text editors, has trouble displaying right-to-left and left-to-right text on the same line in a way that is easily understandable for a human reader.
In the regular expression above, we first typed “حدثن”, followed by the opening bracket; RStudio automatically adds a closing bracket, and the brackets jump to the right of the Arabic word automatically. When you start writing Arabic text into the brackets, the opening bracket jumps to the left of “حدثن”, but the closing bracket remains to the right.
In order to make your patterns more readable, you can break down your regex pattern in chunks that R can display well on one line, and then use the paste() function to concatenate the partial patterns into a single pattern:
ptrn_1 <- "حدثن"
ptrn_2 <- "[ياى]"
ptrn <- paste(ptrn_1, ptrn_2, sep="")  # concatenate the two patterns into a single pattern
This code will create such a plot (you will have to write the regular expression into the code yourself!):
The sheer amount of matches make it dificult to draw far-reaching conclusions from this plot. But at least we can see that
- the use of the term ḥaddatha is much more prevalent in the first two thirds of the work than in the last third
- there are a number of sections in the first third of the work in which the term is not mentioned.
Now, modify the code above yourself to create a dispersion plot for the terms أخبرني and أخبرنا:
The plot shows that the term akhbara is used much less intensively in the book than ḥaddatha, especially in the first third of the book.
These observations do not prove anything by themselves, but they can serve as starting points for further analysis of citation patterns in al-Ṭabarī’s history.
multi-word patterns
The approach outlined above works only with tokenized text.
If the pattern we are looking for is not limited to one specific word, we cannot use a text tokenized into separate words, but have to tokenize it in a different way.
NB: we can also use non-tokenized text, and use the index location of each character in the text as ancher points for the visualization.
One way to do this, is by using each line of text as a token. During the tokenization process (see the setting up code above), we have already created a vector that contains every line as a separate string: lines_v. This line-by-line approach would work well, for example, if we want to contrast the distribution of the use of ḥaddatha in the book in general, with the distribution of the term as the first element in the chain of transmission (that is, the immediate source the author of the book took the report from). Since our text is formatted in OpenITI mARkdown format, we can use the mARkdown tag for the start of a paragraph (hashtag # followed by a space) to identify the cases where ḥaddathanā/ī is the first word of a transmission chain.
Write the regular expression that can be used to identify the instances where ḥaddathanā/ī is the first word of a transmission chain, fill in the plot function, and run the code:
This plot is much more informative than the first plot we made for the term ḥaddatha: it shows that al-Ṭabarī’s use of the term ḥaddatha in the first position of a chain of transmitters (that is, to describe his direct source), is strongly clustered in two sections at the beginning of the work, and gradually declines in the later years of his History.
The contrast between akhbara and ḥaddatha becomes much clearer here: al-Ṭabarī clearly used the term akhbara very rarely in the citation of his own sources, even though the term is used frequently in other positions in the transmission chains.
These graphs can be used as starting-off points for deeper analysis of the citation patterns in al-Ṭabarī’s History.
Full exercise solutions:
ḥaddathani/a as first word in a paragraph:
library("stringr")

# build  the regular expression that can be used to identify the instances where haddathana/i is the first word of a transmission chain:
ptrn_0 <- "^# [وف]?"  # start of line, followed by hashtag and space, and optionally one of the conjunctions wa- or fa-
ptrn_1 <- "حدثن"  # haddathan
ptrn_2 <- "[ياى]"  # alif, ya or alif maqsura
ptrn <- paste(ptrn_0, ptrn_1, ptrn_2, sep="")  # concatenate all patterns into a single pattern

haddathani_first_v <- str_detect(lines_v, ptrn)

# plot the vector (we add some more arguments here to prettify the graph):
plot(haddathani_first_v,
     type = "h",      # "h" stands for histogram
     yaxt = "n",      # do not include tick marks for values on the Y axis
     ylim = c(0, 1),  # set the maximum value of the Y axis to 1
     xlim = c(0, length(lines_v)), # set the maximum value of the X axis to the number of tokens in the text
     main = "Dispersion plot for haddathani/a in initial position",  # title for the plot
     xlab = "Index positions",                   # label for the x axis
     ylab = "",                                  # label for the y axis
)
akhbarani/a as first word in a paragraph:
library("stringr")
# write the pattern here:
ptrn_1 <- "^# [وف]?"  # start of line, followed by hashtag and space, and optionally one of the conjunctions wa- or fa-
ptrn_2 <- "[أا]"  # alif or alif-with-hamza
ptrn_3 <- "خبرن"  # khbaran
ptrn_4 <- "[ياى]"  # i/a

ptrn <- paste(ptrn_1, ptrn_2, ptrn_3, ptrn_4, sep="")  # concatenate all patterns into a single pattern

akhbarani_first_v <- str_detect(lines_v, ptrn)

plot(akhbarani_first_v,
     type = "h",      # "h" stands for histogram
     yaxt = "n",      # do not include tick marks for values on the Y axis
     ylim = c(0, 1),  # set the maximum value of the Y axis to 1
     xlim = c(0, length(lines_v)), # set the maximum value of the X axis to the number of tokens in the text
     main = "Dispersion plot for akhbarani/a in initial position",  # title for the plot
     xlab = "Index positions",                   # label for the x axis
     ylab = "",                                  # label for the y axis
)